Baseline data on gender diversity
Key findings in the 2016 report published by Women Count 2016 include:
- Women now fill 36% of the places on governing bodies for UK HEIs, up from 32% in 2013.
- A third of governing bodies are now gender-balanced (as defined by Hefce) compared to a fifth in 2013 (See diagram 1 below). However, the regular turnover of governors means attention continually needs to be given to maintaining or improving the gender balance.
- Men chair 81% of all governing bodies, with the percentage of female Chairs increasing from 12% in 2013 to 19% in 2016.
- Women chair 26% of the committees overseeing nominations, remunerations and audits.
- The UK and Scotland have shown the most dramatic improvement in female membership of governing bodies. The percentage of women governors has grown from 32% to 38% and female Chairs have increased from 9% to 28%. In 2013 only 11% of Scottish governing bodies were gender-balanced. In 2016, 30% are gender-balanced.
- Wales has increased the percentage of gender-balanced governing bodies from 0% to 25%. The country performs above the UK average for the percentage of female Chairs but lags well behind on the percentage of female Vice-Chancellors.
- Northern Ireland has performed particularly well in terms of female Chairs and Vice-Chancellor/ Principals. In 2013, there were no female Chairs. Today, 20% of all Chairs are female. The percentage of women leading their HEI has grown from 20% to 30%.
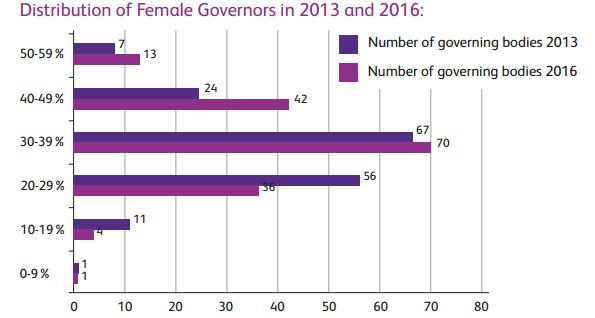
Distribution of female Governors in 2013 and 2016
Diagram 1 (source) shows the proportion (%) of females on the governing bodies of UK HEIs (Total number of institutions = 166)
Data on other aspects of governing body diversity
Since 2013, Hefce’s Annual Monitoring Statement (AMS), covering English institutions, has asked HEIs to return monitoring data on the diversity of their governing bodies.
2015 AMS data revealed that:
- 8% of governors come from black and minority ethnic backgrounds
- 3% declared a disability
For both data fields, there was a high level of non-declaration.
Further reading
WomenCount: Leaders in Higher Education 2016, benchmarks changes taking place in women’s representation in leadership roles in Higher Education Institutions (HEIs) in the UK. The overall direction of change is positive but men still overwhelmingly dominate Chair and Vice-Chancellor roles and are the vast majority of executives and academic heads. Performance across HEIs also varies greatly. The challenge is to quicken the pace at which women are advancing into senior leadership roles, sustain progress made and ensure that every HEI benefits from diverse leadership. The report, sponsored by Perrett Laver, indexes the progress being made across all 166 HEIs in the UK.
Find out more about the value of a diverse governing body