In running our student surveys it is sometimes easy to forget the huge amount of messy data that accompanies the numbers. We receive hundreds of thousands of comments within our surveys from students across the HE sector, covering all aspects of their learning experience. We know that institutions value this data. Analysis on the comments illuminates the student experience in ways our closed survey questions cannot. In our national reports we have made increasing use of open comments, not just in providing snapshots of the student experience, but in providing greater understanding about the differences we see.
Student comments illuminate the stats
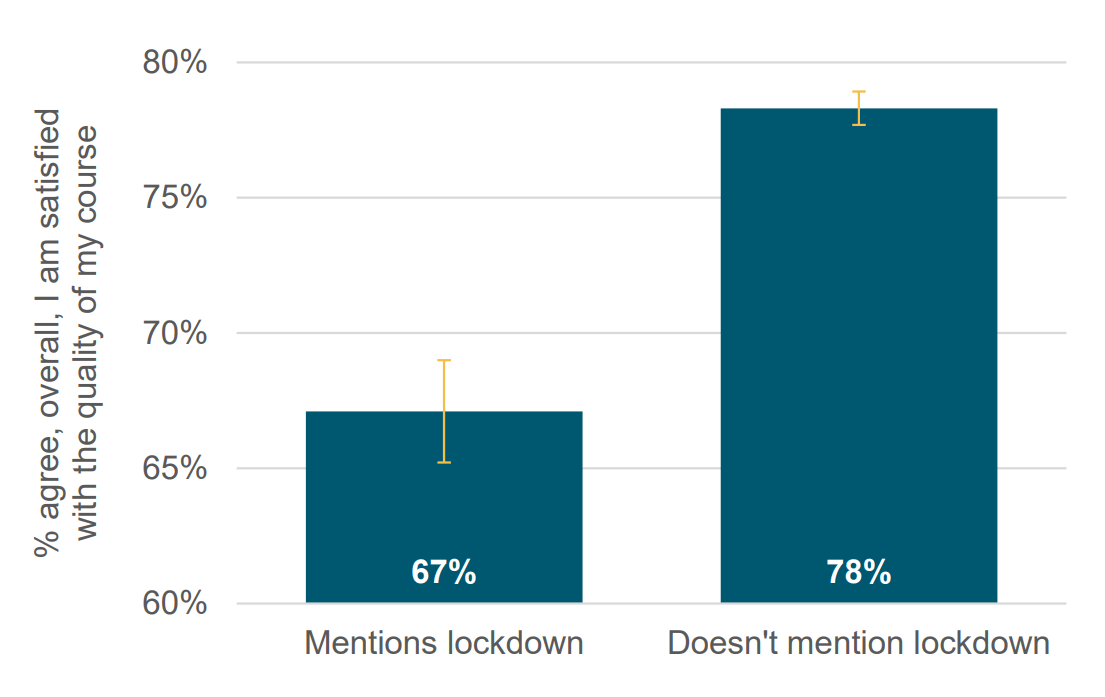
This graph of student comments from PTES 2020 shows how satisfaction amongst students who mentioned lockdown in their comments was significantly lower than satisfaction for students who only mentioned other issues. Even though the question hadn’t been specifically asked, the impact of lockdown as an issue could be clearly demonstrated (1).
Whilst these relationships are evident at the sector level, comparing thousands of comments, this raised an interesting question: Could staff use open comments to understand differences between groups of students at the institutional level?
The simple answer to this question is ‘yes’. We know staff across institutions value student comments and the context they can give to numerical results. However, whilst a student comment usefully reflects upon one experience, it could be a very singular experience. If the numerical results indicated overseas students were unhappy with library facilities, a couple of comments from overseas students about library facilities might seem to illuminate the reasons for it. However, if these reflected exceptional experiences, then the comments might actually obscure the reasons behind the difference. Staff might think there is enough evidence to act, when more conversations or research was really needed.
To understand the links between what students say and what boxes they tick on a survey, I looked at coded comments from our surveys and compared that with what students indicated on closed questions. Nearly every student responds to closed questions, but not every student gives a comment, especially one that relates to a specific item. So I was interested in seeing if there were relationships in the data.
What I found were multiple connections between how often a group of students mentioned an issue and differences in the data. For example, students who had declared a disability frequently mentioned issues around their support for learning. These students were also more likely to negatively respond to the specific likert item about support for learning. This relationship held within institutions, and was particularly reliable where there were more comments.
Now you might be thinking “so what!”. It seems obvious that if a group of students tend to rate something negatively on a closed question then, of course, they will tend to mention it more in comments. But the analysis underscored some important points.
With just a handful of comments relating to a specific item, the relationship between them and the numerical data wasn’t there. Here, the story about data that the comments told might be misleading. It got stronger with just 10 comments, and was robust around 30 comments. This also depended on the strength of differences between groups. Just as we think about statistical variability in looking at data, we should be thinking about variability in the experiences reflected in student comments.
One of the strengths of comments is to go beyond the closed questions into issues that weren’t covered or not covered in much depth. The analysis also showed that comments can illuminate issues not covered by likert scales, not just telling us about the students that have responded, but speaking to the wider student experience.
Of course, all of this does depend on who is commenting.
The analysis found that students more confident in expressing themselves through written English will be more likely to voice their opinions. On average, students fluent in English gave comments 16 words long, the length of this sentence. Students not fluent in English gave comments that were shorter. Their average comment was 10 words long, like this sentence. Someone fluent in English was also much more likely to give a comment in the first place.
How likely are students to comment?
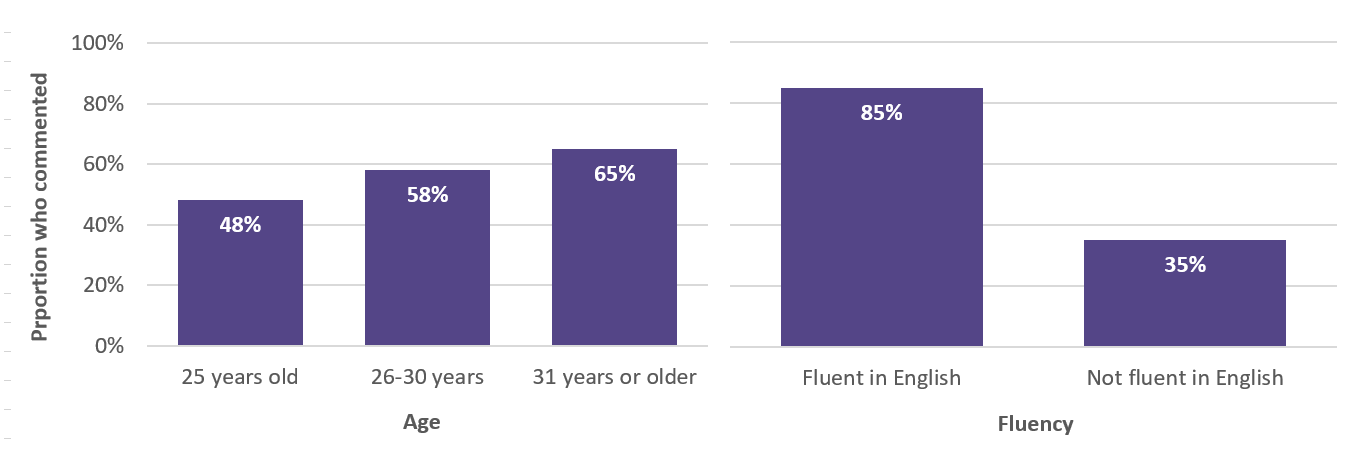
In our survey of postgraduate research students, older students and those fluent in English were more likely to give comments. This means that their voices are more likely to influence our view of the student voice (2).
A final caveat is that, as with any survey results, the differences are just an indicator that something is happening. They rarely provide us with answers. It is just more evidence to inform our continuing conversation about improving the student experience.
Quantitative analysis of coded comments is one approach, but just reading student comments can provide real insight. Although most attention is paid to how comments might vary from course to course, department to department, attention should also be paid to how they vary between groups of students. Do some issues come up in comments more frequently from students who declared a disability? Are students who declared a South-Asian ethnic background making different kinds of comments to those who declared a White ethnic background? These kinds of differences can provide robust evidence and can raise issues that the closed questions didn’t get at.
Of course, it does take time to engage with the messy reality and complexity of student comments. However, if you do have time, they are some of the richest and most flexible data we have.
Notes:
(1) All the reports from our student surveys are available online at www.advance-he.ac.uk/student-surveys
(2) The detailed analysis referred to in this blog is available in ‘Guiding institutional analysis of diversity with coded comments’, Chapter 5 of Analysing Student Feedback in Higher Education