In addition to their data on postgraduate outcomes, the Department for Education (DfE) has released new data showing provider and subject level earnings and employment outcomes for UK residents with a first degree, which will be of interest to Governors and those leading institutions.
Source: DfE, Graduate Outcomes (LEO): Subject by Provider, 2016 to 2017. 26 June 2019, Figure 2, p.9.
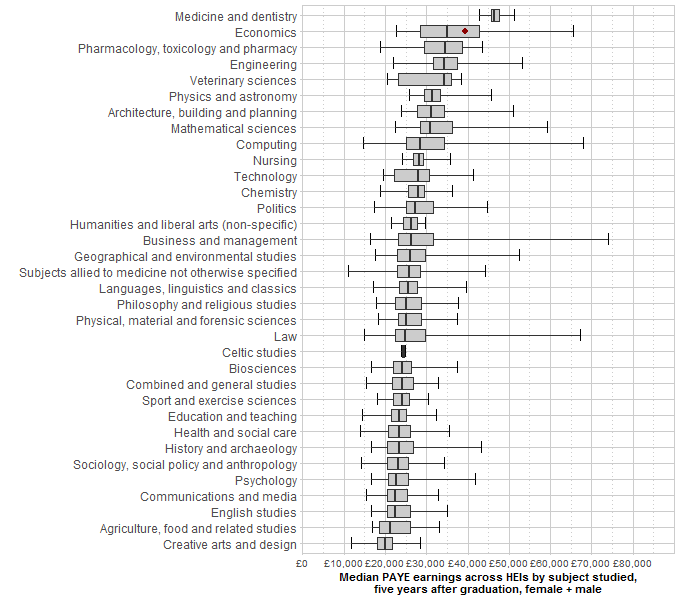
As Figure 1 illustrates, there is considerable variation in the median level of earnings and range of earnings for a given subject. For some subjects, most notably Medicine and Dentistry, the distribution of earnings is very narrow at £9.6k while for others, including Business Management and Law, the range is much larger.
DfE recognise that earnings are likely to be influenced by prior attainment. For example, for Economics it finds the median earnings for graduates of institutions placed in the prior attainment group 1 [the upper quartile of HEIs)] ranged from £36.9k to £65.5k. For those in prior attainment group 3 (the lower quartile of HEIs), earnings ranged from £22.7k to £28.3k.
Employment
There are significant variations in the proportion of graduates in sustained employment, further study or both, five years after graduation. While the data shows the median proportions for all subjects lie between 78% and 98%, there are large differences in some subjects between the minimum and maximum levels. For Architecture, building and planning the minimum level is 40% with the maximum close to 100%.
Statistical workbook
Accompanying the text outlining the results, there is a detailed excel workbook. This contains employment (table 1a) and earnings data (table 1b). Both tables include subject, provider and gender data for one, three and five years after graduation. The tables can be manipulated by the user, allowing comparisons to be made between HEIs.
The government’s view
The response by DfE Ministers to the latest data release was issued with the headline “Vast differences exposed in graduate outcomes”. Further, the comment noted the “wide variation in average earnings and employability by course and institution”.
The Secretary of State for Education was quoted as expressing “his concerns at those (universities) delivering similar courses and not yielding the same results”.
The statement went on to suggest that “previous research from the Institute for Fiscal Studies (IFS) has shown that variation in outcomes cannot be solely attributed to differences in students’ prior attainment and social background, leading to the Secretary of State to suggest that “there are universities that need to improve and maximise the potential of their courses”.
Conclusion
Given the government’s view, leaders of institutions and their governing bodies may wish to carefully examine the latest release from the DfE and consider whether questions are likely to be raised about the earnings and employability of graduates of the courses they offer.
Using the Longitudinal Education Outcomes (LEO) database, the latest release focusses on the earnings and employment outcomes for those graduating in the 2010-11 academic year in the 2016-17 tax year (five years after graduation).
Use of the data
The figures published do not control for differences in the characteristics of graduates (e.g. prior attainment) or region of work. The introduction accompanying the publication suggests “comparison should be made with care” (p.1).
Earnings
The new release uses Pay As You Earn(PAYE) as its main measure of earnings.
Lower quartile (25% of observations lie below), median (divides the distribution of the observations into two halves) and upper quartile (75% of observations lie below) earnings at a provider and subject level are calculated.
Figure 1 shows the distribution of median earnings five years after graduation at the institutions offering a given subject.
For each subject listed in Figure 1 the end points of the associated line show the minimum and maximum median earnings for that subject by institution. Taking Economics as an example, the minimum is approximately £22.7k and the maximum is £65.5k. The two ends of the shaded box in the middle of the line show the lower (c £29k) and the upper quartiles (c £42.7k) of median earnings. The vertical black line in the shaded box is the median earnings (£35k) for the distribution. The range of median earnings after 5 years is c£43k. The red spot included in the box illustrates how data for an individual provider might be added for comparison.