Advance HE’s annual Equality in Higher Education statistical reports present staff and students’ protected characteristics in 300+ data tables, accompanied by comments on how representation and other outcomes (e.g., awarding rates, pay gaps, etc) have changed over time, highlighting key takeaway messages for the sector.
At the recent Wonkhe Festival of Higher Education, Andy Youell presented the path from data to statistics to information to insights in his discussion of how we derive value from the numbers we see. Our annual Equality in Higher Education reports present the data in as much detail as possible and include a degree of digestible information on what these statistics means in terms of progress across the sector.
But how can we derive greater value from the data presented in these reports?
Last year, to mark our 15th annual statistical reports, I presented a time series analysis of key gaps across both the staff and student populations, noting three take-home points:
- There has been progress on equality in a number of areas, and in particular, ethnicity and sex.
- That progress has been incremental, gradually improving year-on-year.
- Rates of progress varied across distinct identities within the overarching protected characteristics.
This year I embark on a different mission – to show, using three key findings from this year’s reports, how you can extract meaning from statistics through:
- The interpretation of statistics alongside corroborating evidence.
- Repackaging the numbers to add nuance and strength to a narrative.
- Using the patterns depicted in the numbers to prepare for the future.
Finding no. 1 – For the first time since 2003/04, the ethnicity degree awarding gap has become ‘wider’.
The ethnicity degree awarding gap (i.e., the difference in the proportions of White UK domiciled first degree undergraduate qualifiers and Black, Asian and minority ethnic qualifiers being awarded a first/2:1) which had been narrowing since 2003/04, has shifted for the first time, widening from 9.0 percentage points in 2020/21 to 10.7 percentage points in 2021/22 (see Figure 1). When we look closely, we see greater increases in the size of the gaps between White qualifiers and Asian Pakistani qualifiers (from 9.6 percentage points in 2020/21 to 13.8 percentage points in 2021/22) and White qualifiers and qualifiers from Other Black backgrounds (from 19.6 percentage points in 2020/21 to 22.6 percentage points in 2021/22).
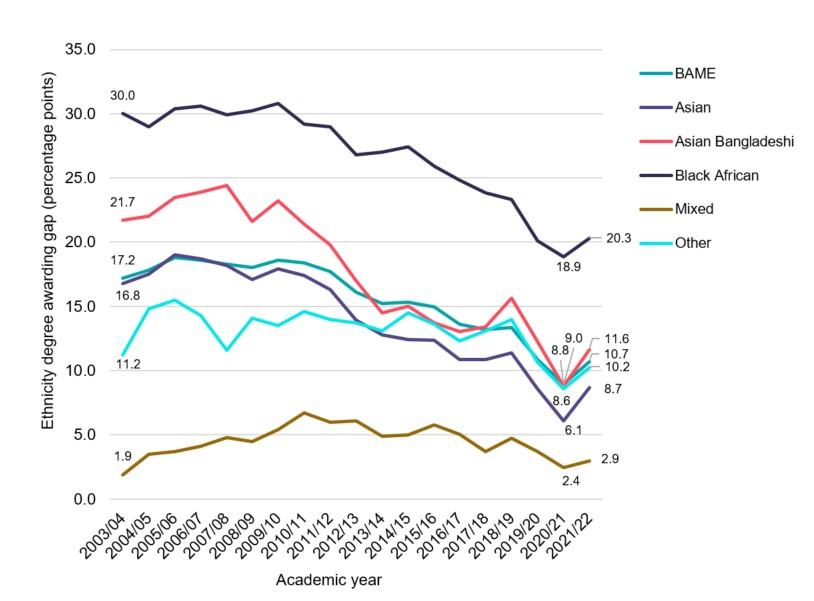
The ethnicity degree awarding gap is a product of the differential experiences of students from different ethnic backgrounds coming together into a single and often binary metric. While awarding gaps are useful in telling us how much two (or more) groups differ, it does not tell us why these are different. Why would the ethnicity degree awarding gap, which has been closing for over a decade, change tide and widen?
To truly derive insights from this indicator we need to interpret it alongside other data describing Black, Asian and minority ethnic students’ experiences and perceptions, as well as research on assessment practices and inclusive education.
So… what do we know?
Well, we know that the shift in assessment practices seen during the pandemic had a positive impact on awarding and continuation gaps. In their recent report, the University Alliance Teaching and Learning network (University Alliance, 2023) summarised the adaptations to assessment practices that institutions put in place during the pandemic that improved their inclusivity, and commented on whether these approaches can be extended into post-pandemic practice. Notably, the changes to assessment during the pandemic were described as embedding support for students – they were flexible, personalised and reduced students’ anxiety around assessment.
However, universities have also committed to reduce the number of firsts and 2:1s awarded to pre-pandemic levels (Universities UK, 2023) and as a result are re-introducing some of the more traditional forms of assessment (for additional information on the actions taken, university degree outcomes statements have been published on UUK’s website). We can see from this year’s HESA records that this shift has been relatively successful in reducing the overall number of first degree undergraduate qualifiers being awarded a first or a 2:1 from 83.5% in 2020/21 to 80.2% in 2021/22. This reduction in the awarding of ‘good degrees’ is primarily driven by a reduction in the number of firsts awarded (from 37.0% of all UK domiciled first degree undergraduate qualifiers in 2020/21 to 33.3% in 2021/22).
However, grade ‘deflation’ hasn’t been experienced equally across different groups of students.
The drop between 2020/21 and 2021/22 in the proportion of students awarded a ‘good degree’ was more pronounced amongst students from Black, Asian and minority ethnic backgrounds (from 76.7% to 72.3%, 4.4 percentage points) than amongst White students (from 85.7% to 83.0%, 2.7 percentage points). This was particularly true for UK domiciled first degree undergraduate qualifiers from Asian backgrounds who were awarded a first (going from 32.9% of Asian qualifiers in 2020/21 to 27.0% in 2021/22).
Taken together, these findings tell us two things. The first is the reaffirmation that a direct link exists between assessment practices and awarding gaps, emphasising the importance of taking assessment into consideration when institutions are deciding on their access and participation plan activities and designing evaluations of interventions addressing differential outcomes for ethnically minoritised students.
The second thing (which we already sort of knew) is that the more stringent approaches to assessment tap into parts of the student experience which we already know are more common amongst White students. For example, being familiar with exam settings, feeling confident to access support from staff, trusting that you will perform well, and so on.
Given that awarding gaps are likely to continue fluctuating over the next few years (as institutions continue to readjust to post-pandemic delivery and assessment and integrate AI-related content into their teaching and learning), how can institutions use this indicator as a valid and reliable measure of their progress towards inclusive education and equity of experience amongst their students?
This is a question I have been exploring in a current project that Advance HE is delivering with TASO and, in my opinion, the solution is to consider an array of outcome measures related to student engagement, belonging and performance (e.g., on individual modules, end of first and second year, etc) as these contribute to student attainment and describe why awarding gaps exist. For instance, we know from the recent National Student Survey results that students from ethnically minoritised backgrounds were fairly positive in how they rated their learning opportunities and their assessment and feedback, but were still disproportionately represented amongst those who did not feel like they could express their ideas, opinions and beliefs on campus (which was also noted in Advance HE’s 2022 UK Experience Survey [UKES] results). The UKES 2022 results contribute additional insight to the context in which we saw the ethnicity degree awarding gap widen, as students from Black, Asian and minority ethnic backgrounds were less convinced about the inclusivity of their campus and their curricula (i.e., were less likely to agree with statements like ‘I hear a variety of opinions expressed on campus’ and ‘The curriculum I study is sufficiently inclusive and diverse’).
Finding no. 2: Female representation amongst academic professors has improved noticeably over the last decade from 21.7% in 2012/13 to 29.7% in 2021/22
In the time series analysis I reported on last year, looking at how staff representation had changed from 2003/04 to 2020/21, there was evidence of slow and steady improvements in female representation amongst academic staff and professorial roles. I recently revisited this analysis while contributing to a book on the Onwards and Upwards project (which tracked and analysed the career paths for women in higher education and explored outcomes associated with the Aurora programme) to explore the magnitude of this change in greater detail.
Specifically, I repackaged the numbers to be expressed in terms of population growth rates instead of proportions to gain a better understanding of these apparently modest but incremental changes.
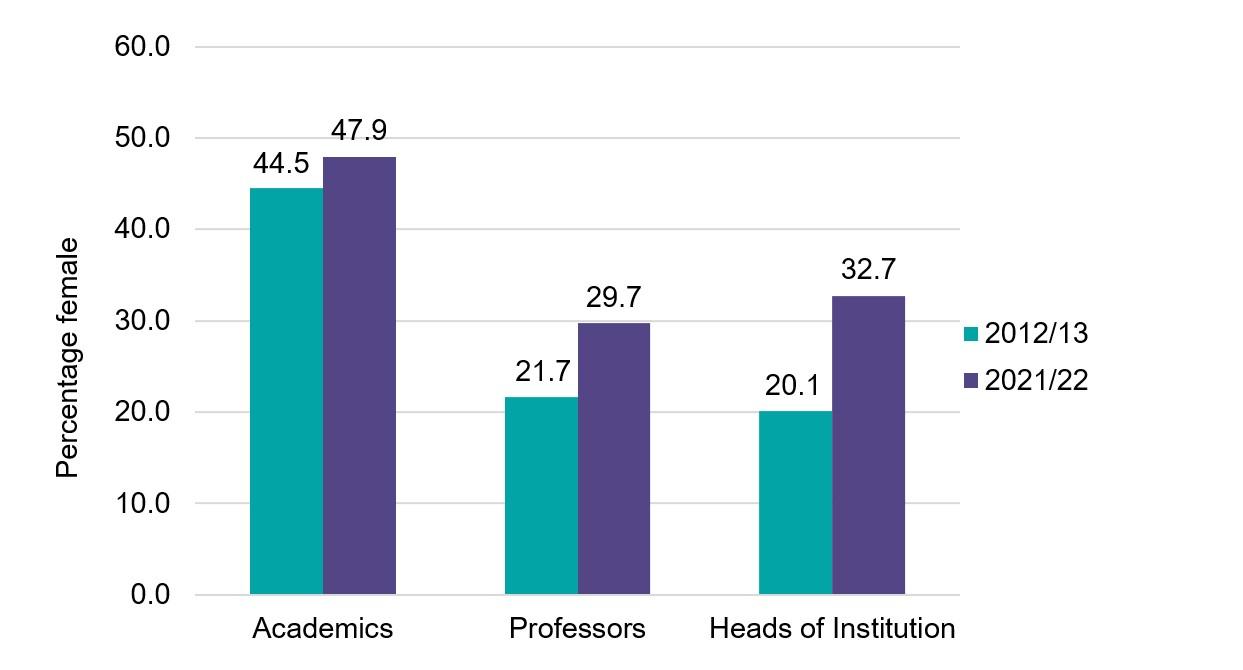
For example, in Figure 2, we see the percentages of female staff at different levels of the academic career path. These percentages tell a positive story in terms of females’ representation improving amongst academic staff and in professorial roles being carried through to more senior levels, with the number of female Heads of Institution doubling from 35 women in 2012/13 to 70 women in 2021/22.
However, percentages are a relative measure of change.
When we look at population growth rates we see a similar narrative but the absolute magnitude of the change is much easier to interpret.
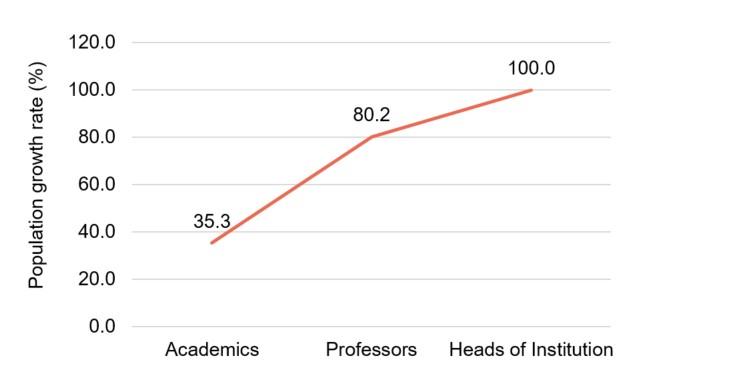
When considered this way, the growth seen in the populations of female professors and of female Heads of Institutions is staggering. The gradual increments documented year-on-year between 2012/13 and 2021/22 transforms into a clear indication of impact of the concerted efforts that the sector is making to improve gender equality.
Transforming the numbers presented from percentages to growth rates provides insight into long-term population trends, allowing us to identify patterns or shifts. This is valuable for anticipating future challenges and opportunities.
Finding no. 3 – Staff and students’ disclosure of a mental health issue is increasing at a huge rate
In 2012/13, 0.3% of higher education staff reported having a mental health condition, compared with 1.1% of staff in 2021/22. In other words, within 10 academic years, the population of staff disclosing a mental health condition has nearly quadrupled. This echoes recent conversations about the ‘epidemic’ of poor mental health amongst university staff (e.g., Wilkinson, 2023). A similarly striking increase is seen for students, going from 1 in 100 students disclosing a mental health in 2012/13 (9.4%) condition to roughly 1 in 50 students in 2021/22 (15.8%).
These percentages however (like those regarding female representation discussed above) are susceptible to the overall size of the population. To understand how the population of staff and students disclosing a mental health condition has really changed over the last 10 years, we need to convert these to absolute terms – i.e., we need to use population growth rates to see the average rate of change in the population size and estimate the magnitude of that change.
When we convert these to population growth rates the gravity of the situation is clear:
Compared with a growth rate of 7.8% for non-disabled staff and 93.9% for disabled staff overall, there has been a 269.3% increase in the population of staff disclosing a mental health condition.
This rockets to 413.6% amongst students disclosing a mental health condition (compared with an overall growth rate of 9.3% for non-disabled students and 96.6% for disabled students).
As noted above, there are obvious contextual contributors to these increases (i.e., a worldwide pandemic, cost of living crisis, etc) as well as a general change in society’s view of mental health, with individuals feeling more confident to seek help when they have a concern about their mental health and to disclose any conditions to their employer.
While it is important to understand which factors are contributing to rising mental health concerns, how we can derive value from these statistics is to use them to prepare for the future.
Since the pandemic, there has been an emphasis on supporting students with a mental health condition through enhanced support services, flexible learning options, wellbeing programmes, peer support networks, training for faculty and staff and collaboration with mental health organisations. Moreover, over the past four years, Student Minds have developed a Mental Health Charter whose resources complement TASO’s recent launch of a student mental health evidence hub and the findings of the Cibyl Student Mental Health Survey. Advance HE’s Insights team was also recently commissioned by TASO to map the reasonable adjustments and transition support offered to disabled students across the sector.
However, these student mental health initiatives aren’t mirrored in terms of sector-level understanding and support of staff mental health. This isn’t to say that institutions aren’t taking action to support their staff’s mental health and wellbeing – many are taking a proactive stance and offering staff access to employee assistance programs, supporting disabled staff networks and encouraging disabled staff to become mentors.
But looking at the rate at which this population of staff is growing, are these activities to support staff mental health sufficient?
This is particularly important as we know that high workloads and capacity are already an issue for both professional support and academic staff, and these are directly linked with anxiety, stress, depression and burn out. Staff are dealing with ever-increasing responsibilities related to reporting and complying with regulatory requirements (e.g., the REF, TEF, Access and Participation Plans, etc, each of which require considerable input). Changes in technology, assessment practices and so on means that staff are working in a fast-paced environment that requires constant professional development and rapidly adapting to change. Moreover, in a recent collaboration between Advance HE and Wonkhe, Heads of Institutions described how institutions are shifting their focus outward, emphasising research impact, enterprise, graduate employability, internationalisation, and stronger connections with their local communities. This shift in institutions’ strategic goals has implications for the demand it puts on its staff, as they will need to develop new approaches and mindsets to fulfil this expanded set of objectives.
Next steps in our data to insights journey
The amount of equality data that the higher education sector has access to is greater than it has ever been. On the one hand, this bombardment of data can make it difficult to establish a clear picture of progress and impact. But on the other hand, we can translate these data into practical insights by:
- Combining them with corroborating evidence
- Repackaging the statistics to highlight key narratives
- Using them as a steer to inform towards future actions.
Equality data presents our sector with opportunities to monitor and evaluate EDI activities, develop evidence-based initiatives and build an inclusive culture that is an example to other sectors.
Equality in Higher Education Statistical Reports 2023
Read our news story and access the reports here
Advance HE members can download the reports, full data tables and infographics below. There is also a briefing event for members to find out more about the report from the authors. Register here.
We are looking to find out more about how members use the reports and gather feedback on their effectiveness. If you would like to contribute, you can complete the survey here.